Lesson Objective: Understanding Butterflies
| Category | Description | Example |
| Key Components | There are two main types of butterflies:
1. The long butterfly: a) One long call (put) at strike A b) Two short calls (puts) at strike B c) One long call (put) at strike C 2. The short butterfly: a) One short call (put) at strike A b) Two long calls (puts) at strike B c) One short call (put) at strike C Where A < B < C. All calls (puts) have the same underlying, same expiration, and the strikes A and C are usually equidistant from B – but not necessarily (in which case the butterfly is called a “broken” butterfly and is taking a directional bias). For the sake of illustration and simplicity, we will consider the case of a long butterfly with calls using equidistant strikes. |
1) Buy one XYZ Jul 20xx $95 Call
2) Sell two XYZ Jul 20xx $100 Calls 3) Buy one XYZ Jul 20xx $105 Call |
| Why Use Butterflies? | Long butterflies are used to take advantage of a possible and favorable change in the volatility of the underlying at a low setup cost. In addition, the potential profit is high in terms of percentage on the capital at risk, so capital usage can be fairly optimal. | XYZ at $100
1) Buy one XYZ Jul 20xx $95 Call 2) Sell two XYZ Jul 20xx $100 Calls 3) Buy one XYZ Jul 20xx $105 Call |
| When to Use Butterflies (outlook)? | Typically, you will use long butterfly spreads when anticipating minimal movement on the underlying (if the strikes are equidistant) while expecting that the future volatility of the underlying will be lower than the initial implied volatility (for instance, after an earnings report has been issued). So, the outlook on the underlying is neutral, and the strategy will be profitable only within a narrow range (approximately if the underlying is between strike A and C at expiration). If the underlying rises or falls too much, you will incur a loss . | |
| Main Risks or Drawbacks of Using Butterflies | You can lose 100% of your investment (the net debit paid to enter into the butterfly). Note that as expiration approaches, small changes in the underlying can have a high impact on the price of the butterfly in terms of percentage, (i.e., Gamma is high as you get close to expiration). So, your window for profit is narrow and your profit situation could change dramatically as expiration approaches. | |
| The Set Up | Buy one call at a lower strike (strike A); this long call is typically OTM
Sell two calls at a higher strike (strike B); the short calls would be ATM in order to receive the highest time (extrinsic) value possible, and Buy one call at an even higher strike (strike C); this long call is typically ITM. However, you could decide to select calls that are all ITM if you wish to focus on a volatility play. |
|
| Net Credit or Net Debit? | Generally, long butterflies are entered for a net debit. | |
| Maximum Profit | Maximum profit is limited to strike B minus strike A minus the net debit paid.
It is reached at expiration when the underlying is at strike B. Note that the likelihood of the underling being at strike B at expiration is slim. |
XYZ at $100
1) Buy one XYZ Jul 20xx $95 Call for $7 2) Sell two XYZ Jul 20xx $100 Calls for $3 3) Buy one XYZ Jul 20xx $105 Call for $1 Net debit of $2 (-$7 + 2x$3 – $1) Maximum profit of $3 ($100 – $95 – $2) is reached if XYZ finishes at $100 at expiration. |
| Breakeven Prices | There are two breakeven prices:
1) Strike A plus the net debit paid 2) Strike C minus the net debit paid |
1) Buy one XYZ Jul 20xx $95 Call for $7
2) Sell two XYZ Jul 20xx $100 Calls for $3 3) Buy one XYZ Jul 20xx $105 Call for $1 The breakeven points are $97 and $103. |
| Maximum Loss | Risk is limited to the net debit paid and you will suffer maximum loss if the underlying is either below strike A or above strike C at expiration. | 1) Buy one XYZ Jul 20xx $95 Call for $7
2) Sell two XYZ Jul 20xx $100 Calls for $3 3) Buy one XYZ Jul 20xx $105 Call for $1 Maximum loss is the net debit of $2 and happens when the underlying is either below $95 or above $105 at expiration. |
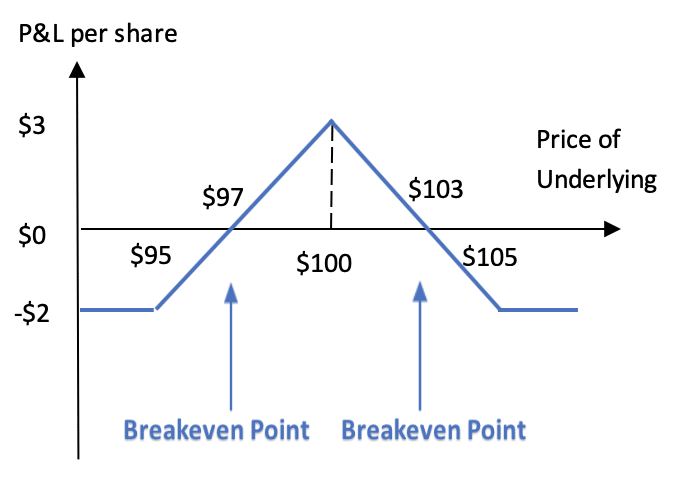
| Profit and Loss (P&L) Chart at Expiration | The P&L chart graphically represents the risk profile of a long butterfly spread strategy.
|
1) Buy one XYZ Jul 20xx $95 Call for $7
2) Sell two XYZ Jul 20xx $100 Calls for $3 3) Buy one XYZ Jul 20xx $105 Call for $1
Note: · The maximum profit of $3 if XYZ is at $100 at expiration · The breakeven points at $97 and $103 · The limited loss of $2 if XYZ ≤$95 or ≥$105 |
| Effect of Price Movements | The long calls have a positive Delta, while the short calls have a negative Delta. Since the strikes of the long calls are equidistant to the strike of the short calls and both types are of the same total number (2 longs vs. 2 shorts), the net delta remains close to zero for most of the life of the spread. | |
| Effect of Time | The spread has a net positive Theta as long as the underlying stays between strikes A and C. If the underlying moves out of this range, Theta becomes negative as expiration approaches, and time works against you then. | |
| Effect of Volatility | Recall that as volatility increases, the value of long options increases while the value of short options decreases, and vice-versa (all else being equal). So, the effect of implied volatility depends on where the underlying is relative to the strikes.
If the underlying is close to strike B, then the short calls carry more weight in determining the net value of the spread. Therefore, the spread will increase in value if volatility deflates. However, if the underlying is near/below strike A or near/above strike C, a rise in volatility will increase the value of the long call to a larger extent than it will decrease the value of the short calls, thereby increasing the overall value of the butterfly. |
|
| Assignment Risk | While the long call has no risk of early assignment, the short calls do have such risk. Early assignment is generally related to dividends, and typically takes place on the day before the ex-dividend date. In-the-money calls for which the extrinsic value is less than the dividend announced have a high likelihood of being assigned. You can assess such risk by looking at the value of the corresponding put (on the pricing chart of your broker), which will provide a good approximation and more direct reading of the time value left in the short calls. If the dividend is higher than the value of the corresponding put, then assignment is likely and action must be taken. | |
| Approval Level Required by Brokers | Usually, the trading of butterflies requires a higher level of approval by brokers because of the complexity of risk-managing the position after it has been established. | |