
Technical analysis provides a framework for traders to study price movement. By analyzing historic market data investors hope to determine the optimal price for buying or selling a security. One of the primary tools used are technical chart patterns, including the analysis of a security’s price and volume.
What is a technical chart pattern?
Technical charts are based on the historic price charts of securities. The analysis of these patterns is referred to as technical analysis. Its aim is to identify transitions between falling and rising trends, including support and resistance price levels. Traders analyze these shapes in order to help project a security’s future price movement.
This type of information allows traders to adapt their portfolios to shifts in the market. This data can also signal the upper (‘resistance’) and lower (‘support’) limits of a security’s price movement in the short-term. As a result traders have more information to help them book gains and/or reduce losses.
There are many recurring chart patterns. So much so that they are commonly referred to by their specific names, eg., ‘head and shoulders’, ‘cup and handle’, etc. Some shapes are considered more bullish, while others are viewed as more bearish.
Example: Cup and Handle chart pattern
Let’s take a specific example to illustrate: the ‘cup and handle’. This technical pattern is considered a bullish signal. The name stems from the actual shape of the price pattern which resembles a tea cup and its handle.
Chart 1: Cup and Handle pattern
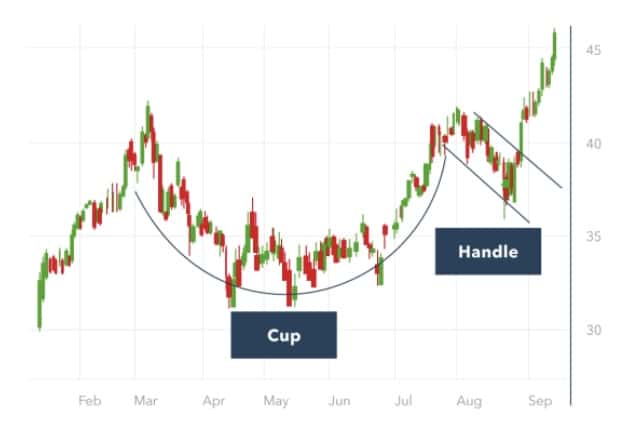
Source: IG
Let’s unpack this. The price movement of the security benefited from an upward trend until March, followed by selling pressure and a gradual rebound (“cup” shape) over the following months. From mid-July to early August the stock tested old (March) highs, before facing selling pressure. Selling pressure can be common after a security tests old highs. This is because holders of the stock, who bought at these levels previously, are looking to exit their positions. This selling pressure often results in consolidation (“handle”) with a downward trend, before the stock price stages a breakout.
While the cup and handle pattern is considered a bullish signal, additional analysis of volume data is advisable. This helps minimize the subjective nature of identifying price chart patterns. For example during the “cup” phase it’s considered bullish if volume levels decline when the stock price falls, and rises as the stock price retests its old highs.
*******
Who are we? The Option Expert accompanies you on your options trading journey. We provide free education and generate trade ideas for our Members.
Our 2-step method:
1. Study the theory 👉 FREE options training course
2. Practice the trades 👉 Become a MEMBER and access our trade ideas